

Mapping the radical changes in the way we use the city's roads
From the 'traffic-light' city centre to the cycle route that has proved a surprise hit

Two topics of conversation never seem to fail: if it isn’t the weather, it is the traffic. Whether it’s bemoaning the wayward behaviour of specific road-users, or lamenting the sheer amount of traffic, we are usually complaining. But what does the data say about Edinburgh’s traffic? Is it really as bad as we think, and how have we changed the ways we move around our city?
We delved into the stats from the roadside traffic counters dotted across our city, to see just how our transport has changed since 2000. Some of this data is estimated rather than manually counted each year, meaning that the street-specific details might not be completely accurate. But the stats definitely point to a transformation in our city’s roads over the last quarter of a century - and they make for some quite pretty maps too (even if we do say so ourselves).
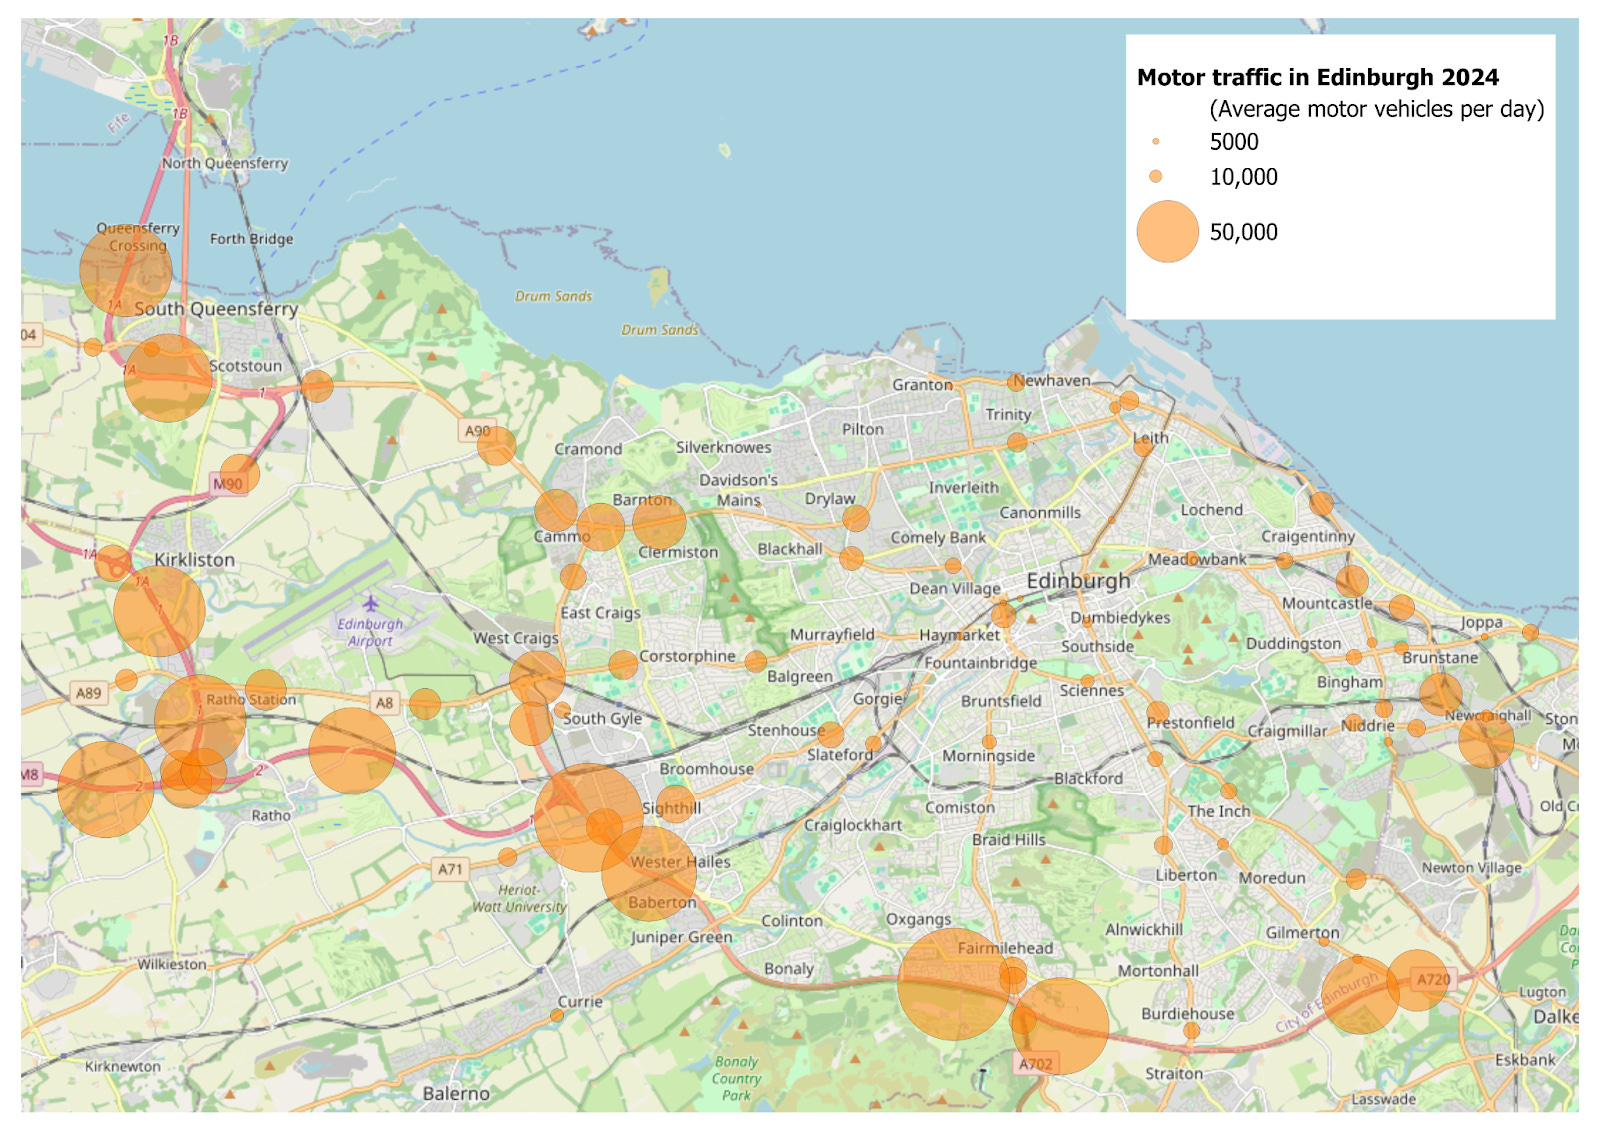
The first thing to note is that Edinburgh, particularly its surrounding roads, sees a huge throughflow every day. The busiest points on the bypass see an average of around 70,000 vehicles pass, and the main roads into town regularly see over 25,000 vehicles a day.

Continue reading this post for free, courtesy of Edinburgh Inquirer.
 | A guest post by
|